


BOSTON–Boston ranked as the second-most expensive office market in the Northeast in November, underscoring its continued prominence despite a slower national office recovery, according to a new report from CommercialCafe based on Yardi Research data.
Asking rents for Boston office space averaged roughly $49 per square foot in November, trailing only Manhattan, where listing rates led the region at about $68 per square foot. By comparison, Philadelphia posted average asking rents of nearly $32 per square foot, making it the only major Northeastern market with office rents below the national average of approximately $33 per square foot.
Beyond pricing, Boston stood out for its development activity. The market led the Northeast office construction pipeline with approximately 4.1 million square feet of space under development in November. Manhattan followed with close to 3 million square feet under construction. Combined, Boston and Manhattan accounted for about 22% of the national office construction pipeline, which totaled roughly 32 million square feet.
Sales activity across the region remained dominated by New York City. Manhattan office transactions totaled nearly $7.3 billion year-to-date through November, the highest volume not only in the Northeast but in the entire country. Properties in Manhattan traded at an average of $514 per square foot, nearly three times the national average of $190 per square foot.
Boston ranked a distant second in transaction volume, with year-to-date office sales of about $1.4 billion through November. Boston office properties traded at an average of $171 per square foot, ahead of New Jersey’s $156 per square foot but well below Manhattan’s pricing. New Jersey followed Boston in total sales volume at just over $1.2 billion, while Philadelphia recorded approximately $560 million in office transactions.
Vacancy levels remained elevated across markets, reflecting ongoing challenges for the sector. Boston’s office vacancy rate stood at 15.4% in November, compared with 13.4% in Manhattan and 18.5% nationally. While vacancy has edged down modestly year over year, physical office occupancy continues to lag pre-pandemic levels.
Nationally, the office construction pipeline has continued to shrink, with projects under construction or planning representing less than 2% of total office stock, down from 3% a year earlier. Still, Boston, Manhattan and Dallas were the only U.S. markets with more than 2 million square feet of office space under construction in November.
The report also highlighted the growing role of coworking. About 22 million square feet of coworking space opened nationwide in 2025, a 16% increase from the prior year, as hybrid work models drive demand for more flexible office solutions.
“While New York City is leading the office comeback and the AI sector is driving recent demand in San Francisco and the Bay Area, office recovery elsewhere has been nuanced and varies greatly city by city and even building by building,” said Peter Kolaczynski, director of Yardi Research. “Though we are seeing localized winners, the overarching challenge remains the lower physical occupancy rate compared to pre-Covid numbers.”
For Boston, the data point to a market that remains expensive and active by regional standards, supported by a sizable development pipeline, even as broader structural shifts continue to reshape the U.S. office landscape.
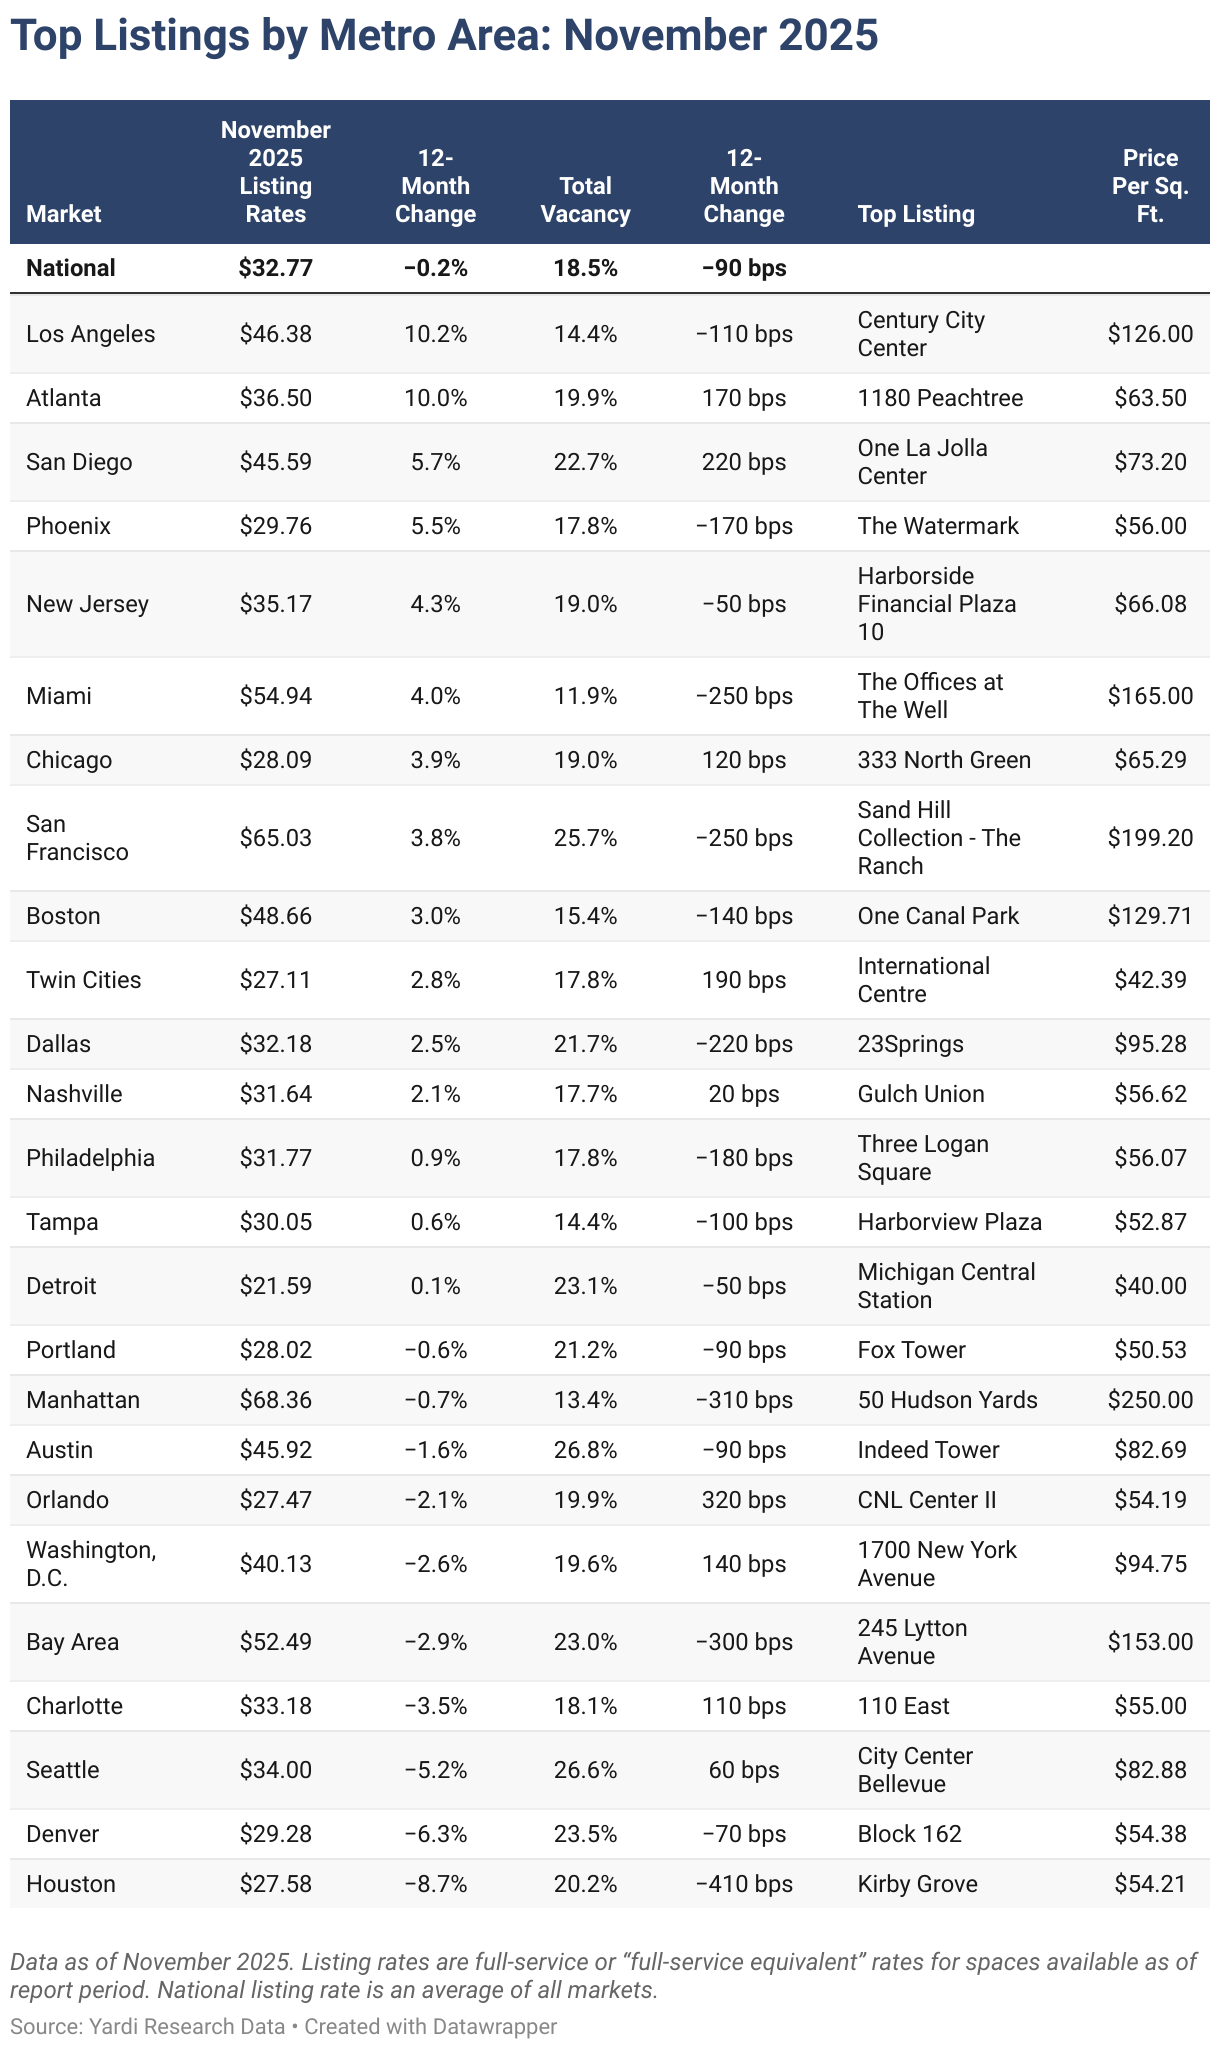
Top Listings by Metro Area: November 2025
| National | $32.77 | −0.2% | 18.5% | −90 bps | ||
|---|---|---|---|---|---|---|
| Los Angeles | $46.38 | 10.2% | 14.4% | −110 bps | Century City Center | $126.00 |
| Atlanta | $36.50 | 10.0% | 19.9% | 170 bps | 1180 Peachtree | $63.50 |
| San Diego | $45.59 | 5.7% | 22.7% | 220 bps | One La Jolla Center | $73.20 |
| Phoenix | $29.76 | 5.5% | 17.8% | −170 bps | The Watermark | $56.00 |
| New Jersey | $35.17 | 4.3% | 19.0% | −50 bps | Harborside Financial Plaza 10 | $66.08 |
| Miami | $54.94 | 4.0% | 11.9% | −250 bps | The Offices at The Well | $165.00 |
| Chicago | $28.09 | 3.9% | 19.0% | 120 bps | 333 North Green | $65.29 |
| San Francisco | $65.03 | 3.8% | 25.7% | −250 bps | Sand Hill Collection – The Ranch | $199.20 |
| Boston | $48.66 | 3.0% | 15.4% | −140 bps | One Canal Park | $129.71 |
| Twin Cities | $27.11 | 2.8% | 17.8% | 190 bps | International Centre | $42.39 |
| Dallas | $32.18 | 2.5% | 21.7% | −220 bps | 23Springs | $95.28 |
| Nashville | $31.64 | 2.1% | 17.7% | 20 bps | Gulch Union | $56.62 |
| Philadelphia | $31.77 | 0.9% | 17.8% | −180 bps | Three Logan Square | $56.07 |
| Tampa | $30.05 | 0.6% | 14.4% | −100 bps | Harborview Plaza | $52.87 |
| Detroit | $21.59 | 0.1% | 23.1% | −50 bps | Michigan Central Station | $40.00 |
| Portland | $28.02 | −0.6% | 21.2% | −90 bps | Fox Tower | $50.53 |
| Manhattan | $68.36 | −0.7% | 13.4% | −310 bps | 50 Hudson Yards | $250.00 |
| Austin | $45.92 | −1.6% | 26.8% | −90 bps | Indeed Tower | $82.69 |
| Orlando | $27.47 | −2.1% | 19.9% | 320 bps | CNL Center II | $54.19 |
| Washington, D.C. | $40.13 | −2.6% | 19.6% | 140 bps | 1700 New York Avenue | $94.75 |
| Bay Area | $52.49 | −2.9% | 23.0% | −300 bps | 245 Lytton Avenue | $153.00 |
| Charlotte | $33.18 | −3.5% | 18.1% | 110 bps | 110 East | $55.00 |
| Seattle | $34.00 | −5.2% | 26.6% | 60 bps | City Center Bellevue | $82.88 |
| Denver | $29.28 | −6.3% | 23.5% | −70 bps | Block 162 | $54.38 |
| Houston | $27.58 | −8.7% | 20.2% | −410 bps | Kirby Grove | $54.21 |
To read the full report, please click here.


